Every year John AC6SL creates an animated section map of our Field Day data, which we then see at the July club meeting. This year the animation is visible on our web site! (Assuming that you have a browser that can display APNG files. Sorry, Internet Explorer!)
If the map below is not animated with flashing lines, then try clicking on the map or using another kind of web browser.
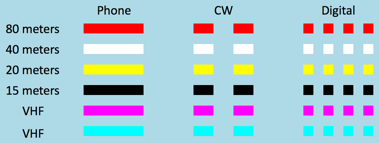
The color of the lines and circles in the animated map indicates bands. The diameter of each circle indicates the number of QSOs made with that section. Each flashing colored line represents a QSO. The style of each line indicates the mode of each QSO.
Thanks John!
Key: